What is a Gantt Chart in Project Management? Definition & Examples


You will find various, simplified definitions of project management, on and off the web. But project management is far more complex and exists in a state of constant flux, with shifting priorities, competing requirements, and interdependent tasks.
What you need here is a Gantt Chart in project management. Studies have proven that the human brain processes visual cues faster, in 13-80 milliseconds, much more efficiently than text or verbal explanations, and Gantt Charts work on this principle. They offer a visual representation of your project timeline.
As a project manager, the Gantt Chart is the best tool to have in your kit.
This guide will help you understand what Gantt Charts are, how they benefit you, how you can create them, and more. To get you started, we will also discuss how Meegle's Gantt Charts can simplify project management for you.
By the end, we’ll also talk about the best Gantt Chart project management software for project teams.
- Gantt charts visually map project tasks, timelines, and dependencies for clear project planning.
- Each task is displayed as a bar with start/end dates, duration, and assigned resources.
- Gantt charts improve team alignment by showing task progress, ownership, and upcoming milestones.
- They're essential for managing complex projects with sequential or interdependent tasks.
- Project managers use Gantt charts to allocate resources, set milestones, and track deliverables.
- Tools like Meegle automate Gantt charts, enabling real-time updates, collaboration, and tracking.
What is a Gantt Chart?
A Gantt Chart is a horizontal bar chart used in project management that represents a project's progress over time. These charts are used to plan and schedule projects, track progress, coordinate team efforts, and assign deadlines.
Its USP lies in breaking tedious, complex projects into simple, sequential tasks that need to be completed in order.
Here are the questions that a Gantt Chart answers at a glance:
- What are the key activities and tasks in the project?
- How is the project divided into tasks and phases?
- What are the start and end dates for each task?
- Who is responsible for each task?
- When are the important meetings and approvals scheduled?
Watch this video to learn more about the Gantt Chart: https://youtu.be/fB0wsdmV3Sw
What are the key components of a Gantt Chart?
The key components of a Gantt Chart include tasks, timelines, dependencies, milestones, progress bars, resources, start/end dates, and task assignments.
Let’s look at each one of these:
- Task list: Displays a hierarchical list of all tasks on the left side of the Gantt Chart, organized into groups and subgroups
- Timeline: Shows the horizontal scale of time at the top of the chart, displaying time units such as months, days, and years
- Dependencies: Connects tasks with light gray lines, indicating the sequence of tasks and their interdependencies
- Resource assigned: Identifies the team member responsible for each task, providing details about resource allocation
- Bars: Represents tasks as horizontal bars on the right side of the chart, displaying start dates, end dates, and durations
- Progress: Tracks task completion by showing how much work is done and the estimated time remaining
- Current date marker: Highlights the present date with a vertical line on the task chart
- Milestones: Marks significant updates, deliverables, deadlines, and decisions with a gray circle and flag icon
Together, these components provide a clear visual representation of the project’s timeline, progress, and dependencies, enabling efficient planning and execution.
How does a Gantt Chart work?
A Gantt Chart may seem intimidating at first, but it is as easy as reading the bar graphs in your statistics class. It has a horizontal x-axis representing the timescale against the vertical y-axis, which represents the projects and task activities.
In Meegle, the data entered on the left is visually represented as a cascade of bars on the right, making it easier to determine the project schedule and track progress visually. The more data you enter on the left side, the more it populates the corresponding bars on the right.
Each bar represents a start date and end date, mapped against the timeline. When a task progresses, the taskbar fills up to indicate the progress.
Similarly, task dependency is represented by using a gray line that joins the two interconnected tasks. Resource assignments can be determined by clicking on the Member Schedule option against each task at the top of the chart.
What are Gantt Charts used for?
Gantt Charts in project management are used for project planning and organizing projects visually on a timeline.
Here is why Gantt Charts are the most useful visualization tool for project management:
- Visualize the timeline: Provide a clear overview of tasks across a timeline, helping teams understand the project's structure and timing at a glance.
- Align task dependencies: Highlight the relationships between tasks, showing which ones need to be completed first and how delays can impact the overall workflow.
- Resource management: Assign tasks to specific team members with clarity, helping everyone understand their roles and responsibilities within the project.
- Track progress: Monitor task completion visually, allowing teams to see what’s achieved, what’s in progress, and what’s coming up next.
- Milestones: Mark critical project points like deliverables or decisions, helping teams focus on important achievements and the steps needed to reach them.
- Team collaboration: Create a shared space where everyone can see the project’s progress and stay aligned with timelines and goals.
All these elements give a bigger, broader picture of your tasks and their progress so that project managers can plan the project budget and timeline.
When should you use Gantt Charts?
Gantt Charts in project management are used to turn complex projects into manageable tasks. They are specifically useful when:
- Tasks follow a sequential order
- Resources need to be managed effectively, ensuring tasks are assigned equally
- A project is approaching a hard deadline
- Team members need a clear overview of the project and task progress
- Coordination with multiple people and managing multiple projects is required
- Determining the duration of each task is essential.
The breakdown of tasks further demonstrates what needs to be done and in what order.
The benefits of using Gantt Charts
Gantt Charts are one of the most important project management tools used across various industries. For project and program managers, these charts offer numerous benefits.
Let’s look at these in detail:
- Brings clarity to planning: Projects are divided into manageable tasks, mapped by priority on a single visual timeline, helping teams plan more effectively.
- Strengthens team alignment: Teams stay unified around common goals, with everyone aware of current progress, upcoming tasks, and their contributions to the bigger picture.
- Highlights critical connections: Task dependencies are visually mapped, illustrating how work flows across the project, ensuring teams maintain progress without disruptions.
- Drives accountability: Tasks are directly assigned on the chart, giving team members clear ownership of responsibilities and fostering trust and commitment.
- Motivates teams: Milestones and completed tasks are visually tracked, providing a sense of achievement and keeping teams engaged and motivated.
Who should use a Gantt Chart?
Historically, Gantt Charts were used by formally trained project managers in different fields such as engineering, manufacturing, construction, IT, and even military. Since no tools existed to automate Gantt Charts, manual training was necessary to manage projects.
With the advancements in technology, it has become easier to manage your projects, even if they are complex and have various moving parts. With the automation of repetitive tasks, managers can reduce errors and improve accuracy effectively.
Today, project management software like Meegle, designed to streamline task scheduling and visualization, allows users to add project tasks and start and end dates.
Gantt Charts are versatile and applicable across various industries, including:
- Marketing teams
- Product development teams
- Software development teams
- Construction managers
- Manufacturing teams
- Engineering teams
- CEOs, CTOs, thought leaders, and more.
How can you create Gantt Charts for your projects?
Let’s understand how to use Gantt Charts for creating project plans, schedules, and tracking using the chart maker software.
-
Create a work breakdown structure
A work breakdown structure (WBS) is an important step in project planning. It allows managers to divide the project into smaller components, such as tasks, subtasks, and deliverables, to determine the total scope of work required for the project.
It is best to create a work breakdown structure in the Tree view, a hierarchical format that allows team members to visualize tasks and subtasks. It allows team members to view each task and subtasks. WBS is also essential for projects since it is used to create dependencies for the subsequent tasks and subtasks.
2. Build a Gantt timeline
Once you’ve identified the tasks and subtasks, it’s time to list them as activities on the left side of the grid. On the Gantt table, enter the start date, due date, and additional details such as the cost estimates, resource needs, and other project requirements. You can also add the members and teams assigned for each of these tasks.
At the top, create a Gantt timeline to map your tasks against a specific timeframe. For instance, the Gantt timeline can be divided into weekly, monthly, bi-monthly, or even yearly scales.
3. Set project milestones
To the left side of your Gantt Chart grid, add the key dates, such as the date of deliverables, objectives, and final requirements to complete a task. This will be listed as a milestone on the Gantt bar chart.
4. Identify task dependencies
Now that you have listed the tasks, subtasks, and milestones, link them together by drawing a line. Unlike Kanban boards, which visualize tasks individually, Gantt Charts highlight task dependencies by showing how delays in one task affect others.
Here’s the catch:
Gantt Chart tools don’t automate the task dependencies. Instead, the project managers need to create a sequential order to connect these tasks to avoid mess and inaccuracy.
5. Track milestones
In addition to tracking tasks, it's important to monitor key project milestones. Like a Gantt Chart for timelines, you can use a project management tool to create a milestone chart.
6. Allocate and track resources
After planning and scheduling your tasks on the Gantt timeline, add the necessary resources needed to complete your project on time. Use project management software to allocate the resources to the right person and track their utilization throughout the project lifecycle.
For instance, Meegle provides a real-time update on resource utilization and monitors manpower distribution. On the left side of the chart, you can view the individual task allocation for scheduled, unscheduled, and person-day (PD) tasks.
Gantt Chart Use Cases in Project Management
Gantt Charts serve a wide range of industries and applications, offering flexibility through user-friendly software.
Here are some of their best use cases:
-
Use of Gantt Chart in IT project management
An IT project plan, say a software development plan or a product development plan, has many tasks that may run simultaneously or are interdependent. Gantt Charts are a great way to visualize the tasks and break the complex ones into subtasks.
For example, in software development, tasks such as UI/UX design, backend development, testing, and deployment often overlap.
A Gantt Chart clarifies:
- Task dependencies: Backend development must be completed before API integration, while testing depends on completed feature implementation.
- Parallel tasks: UI/UX design and front-end development can happen simultaneously to save time.
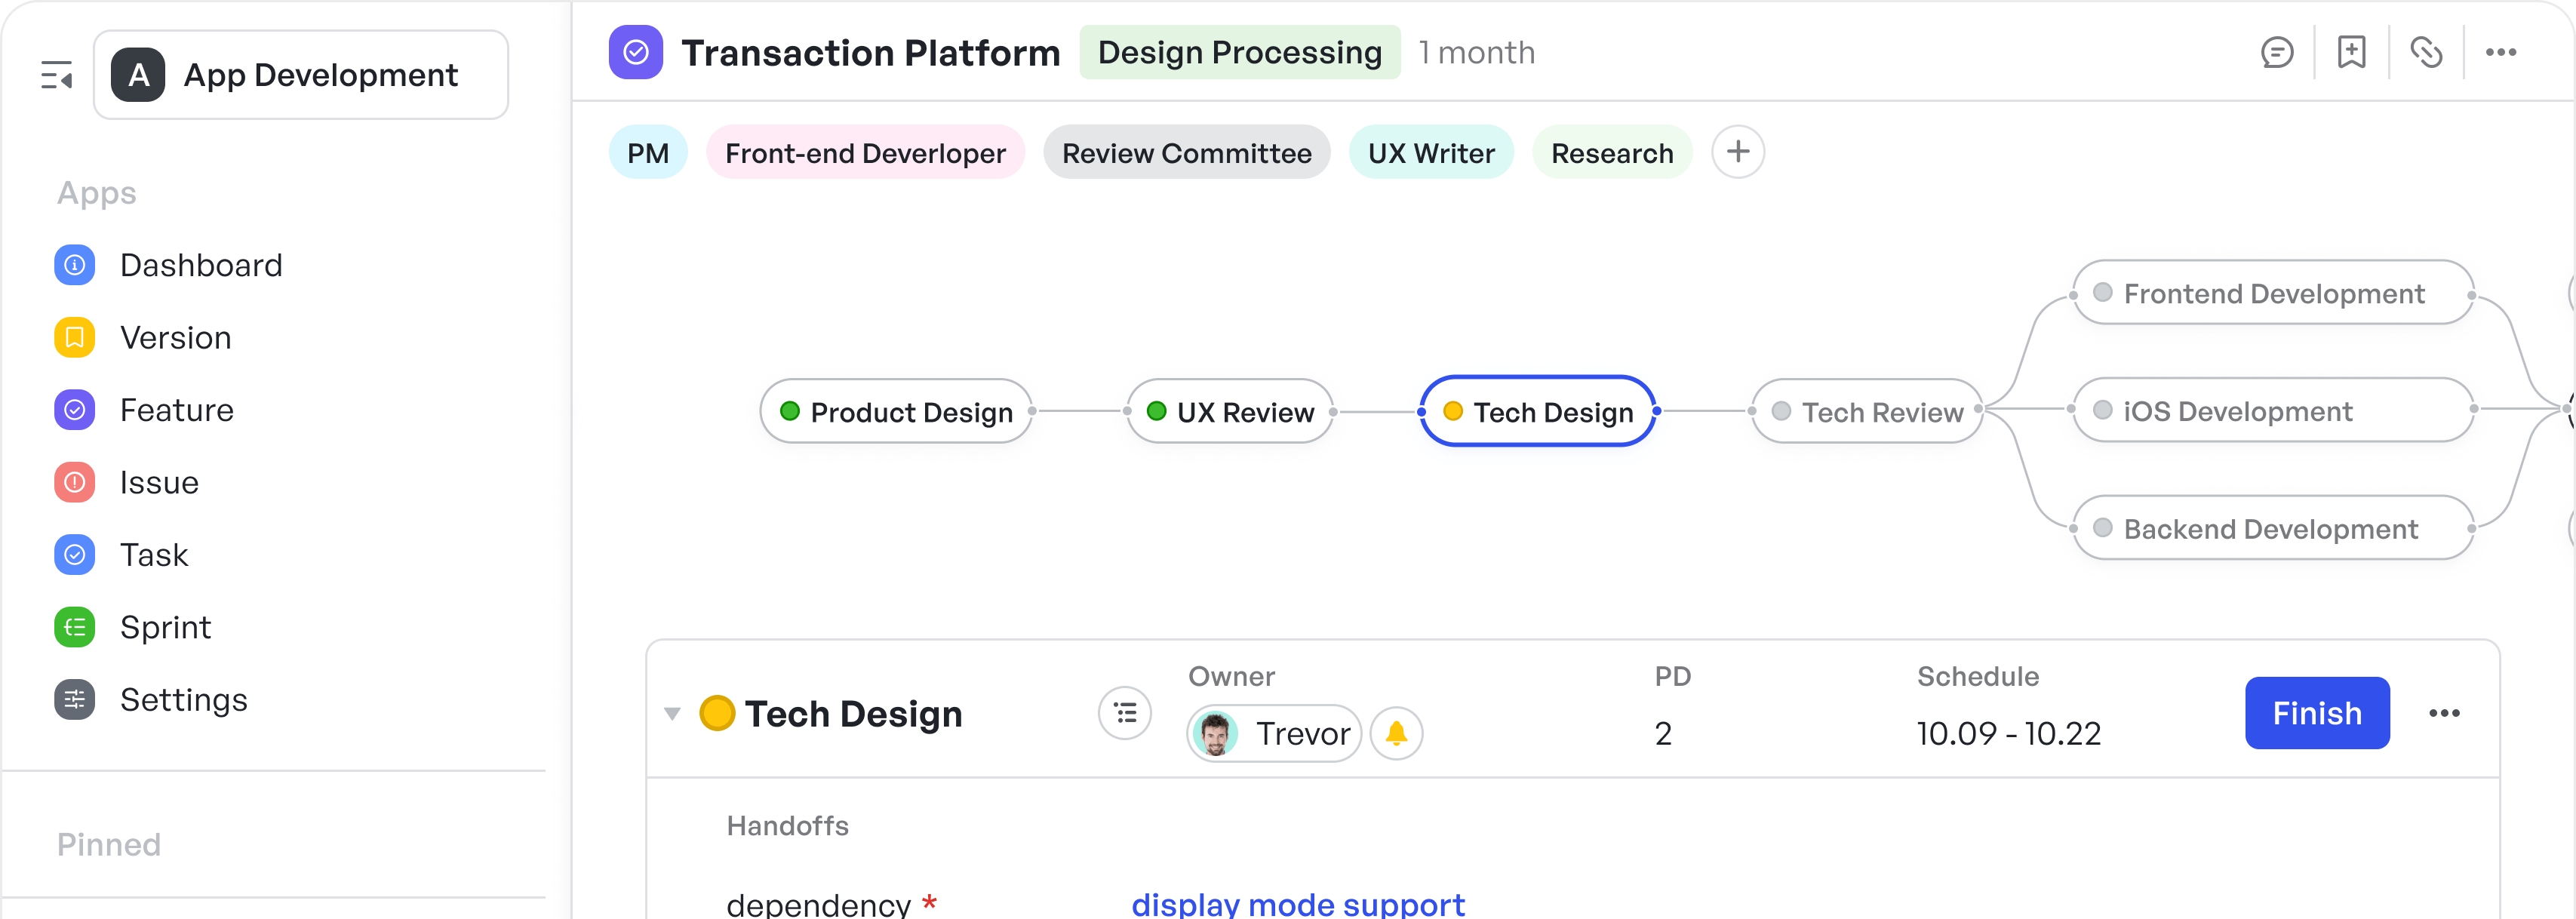
In the Gantt diagram:
- A green circle marks project completion.
- A yellow circle highlights an ongoing task.
- Each subtask displays an assigned team member’s image—e.g., a developer handling API integration, a QA engineer managing test cases, or a product manager overseeing milestones.
This real-time visibility enables teams to track task ownership, ensuring clear responsibility for development, testing, and approvals. It also helps with progress tracking, identifying which tasks are on schedule, delayed, or at risk. Additionally, it ensures workflow alignment, making sure dependencies are met before moving to the next phase.
Related Read:
2. Use of Gantt Chart in construction project management
While managing construction projects, the interplay of roles—project managers, civil and structural engineers, mechanical specialists, and contractors—creates a dynamic, interdependent workflow. Factor in materials, equipment, and labor, and the complexity increases exponentially. Managing all of this manually introduces inefficiencies, miscommunication, and costly delays.
A Gantt Chart functions as a structural framework, visually mapping out each task within the project’s timeline. If a foundational phase encounters setbacks—weather disruptions, material shortages, or unforeseen site conditions—the engineer responsible can modify the timeline, automatically adjusting dependent tasks like framing, electrical work, and roofing.
Related Read:
3. Use of Gantt Chart in manufacturing project management
Gantt Charts are also useful in manufacturing project management since it keeps the employees and other stakeholders involved and informed. The chart indicates the entire process, from production scheduling, assembly line setup, or equipment maintenance, from a single point of view.
By breaking down the entire process into different stages such as procurement, assembly, quality inspection, and logistics, everyone gains visibility into what needs to be done and when. For example, the Gantt Chart clarifies that component manufacturing must be completed before assembly begins, while quality checks depend on the completion of each production phase.
Each subtask also displays the assigned team member’s image—e.g., a machine operator, a quality inspector verifying tolerances, or a supply chain manager tracking raw material deliveries. This improves the coordination between the teams and makes the operation even smoother.
Why Meegle Is the Best Gantt Chart Software for Project Management
What sets Meegle apart is its multi-project tracking, customizable views, and advanced resource management. The table below highlights how Meegle outperforms Microsoft Project, Monday.com, and Smartsheet, delivering greater functionality and ease of use for project teams across industries.
| Feature | Meegle | Microsoft Project | Monday.com | Smartsheet |
|---|---|---|---|---|
| Ease of Use | Highly intuitive, user-friendly interface | Steep learning curve, complex UI | Easy to use with a modern UI | Moderate learning curve |
| Task Dependencies | Advanced task linking with automatic adjustments | Task dependency tracking with manual updates | Basic task dependencies with manual adjustments | Decent dependency tracking, manual updates required |
| Real-Time Collaboration | Seamless real-time collaboration with instant updates | Limited real-time collaboration, relies on integrations | Good real-time collaboration with team updates | Strong collaboration with real-time team updates |
| Automated Scheduling | Smart scheduling with automated timeline adjustments | Manual scheduling with limited automation | Semi-automated scheduling, manual intervention required | Limited automation for scheduling |
| Customizable Views | Multiple views (Gantt, Table, Kanban, Tree, Measure) | Limited customizable views | Customizable with various templates | Multiple views available (Grid, Gantt, Card, Calendar) |
| Resource Management | Comprehensive workload distribution and member scheduling | Resource management but complex to use | Basic resource allocation tracking | Good for tracking workload, but lacks advanced AI-based allocation |
| Multi-Project Tracking | Supports multiple project spaces and cross-team scheduling | Multi-project support with high complexity | Supports multi-project tracking with limited scalability | Multi-project tracking with manual oversight |
| Pricing | Competitive, scalable pricing options | High-cost enterprise pricing | Subscription-based, mid-tier pricing | Subscription-based, varies by features |
Meegle’s Gantt view offers a clear, time-based progress tracker within projects.
- Displays work item progress across sprints in a visual format
- Helps teams identify delays, track dependencies, and adjust schedules proactively.
Here is how Meegle works as the best Gantt Chart software:
Identifing task dependencies
Meegle’s task dependency feature ensures that milestones and tasks are linked, making it easy to visualize and manage dependencies. Here is how it helps:
- Project managers can easily spot and adjust critical tasks that impact project timelines.
- If a task is delayed, dependent tasks automatically shift, ensuring accurate scheduling.
- Teams can foresee potential delays and address roadblocks before they impact deadlines.
Enabling real-time collaboration
With customizable views (Table, Kanban, Gantt, Tree, and Measure), teams can switch between perspectives based on their workflow preferences.
- Live task updates: Team members can modify tasks, update progress, and adjust schedules instantly.
- Role-based access control: Ensure team members only see what’s relevant to them, reducing clutter and enhancing focus.
- Commenting & notifications: Keep everyone in the loop with task-specific discussions and instant alerts when changes occur.
Whether they need a high-level timeline overview or detailed task insights, Meegle ensures effortless collaboration across departments.
Facilitating project scheduling
Meegle’s Gantt Chart features streamline scheduling, tracking, and workflow optimization with:
- Multi-dimensional time views (month, 2 months, quarter, half-year, year) for flexible timeline adjustments
- Drag-and-drop scheduling to adapt quickly to shifting priorities
- Member schedule tracking for workload balancing across multiple projects
- Automated notifications to alert teams about schedule changes or delays.
Meegle’s Gantt Charts are designed to simplify project management by providing time-based visual tracking, resource allocation insights, and real-time scheduling flexibility.
Moreover, Meegle offers flexible pricing plans to suit teams of all sizes.
- The Free Plan supports up to 20 users with essential features like visual workflows, multiple views, including Gantt, Table, and Kanban—and 100GB of storage.
- The Standard Plan ($8/user/month) is ideal for small teams, adding reports, data import/export, and 2TB of storage.
- For mid-sized teams, the Premium Plan ($12/user/month) includes advanced tools like Panorama view, auto-scheduling, and 20TB of storage.
- Large enterprises can opt for the Enterprise Plan, which offers custom pricing with enhanced security, branding, and data restoration.
Meegle also provides free access to schools and non-profits.
Whether managing multiple teams, tracking dependencies, or planning manpower distribution, Meegle ensures that projects stay organized, efficient, and on schedule.
Try Meegle’s Gantt Chart today and keep your projects on track!
FAQs
Who uses Gantt Charts?
Gantt Charts are used by project managers, team leads, engineers, marketers, construction planners, software developers, and operations managers to plan, schedule, and track tasks across industries like IT, manufacturing, construction, and event management.
How do Gantt Charts compare to other project management tools?
Unlike basic task lists or Kanban boards, Gantt Charts provide a timeline-based view, helping teams visualize dependencies, track progress, allocate resources, and adjust schedules dynamically, making them ideal for complex, multi-phase projects.
Can you create a Gantt Chart in Excel or other tools?
Yes, Excel allows you to create basic Gantt Charts using bar charts, but dedicated project management tools like Meegle, Microsoft Project, and Smartsheet offer advanced automation, real-time collaboration, and task dependencies, making project tracking much more efficient.
The world’s #1 visualized project management tool
Powered by the next gen visual workflow engineStart creating impactful work today