Top 8 Gantt Chart Software for 2025


Effective project management has never been more critical. With teams spread across different locations—remote, hybrid, or in-office—and a growing number of complex projects, staying organized can be a constant struggle. The added uncertainty of changing economic conditions only adds to the difficulty of keeping everything on track.
One tool that remains highly effective in managing project workflows is the Gantt chart. It allows you to visualize timelines, track multiple projects simultaneously, and manage teams and goals more efficiently. When combined with robust project management software, Gantt charts become even more powerful.
In fact, studies suggest that the project management software industry is expected to experience significant growth, with projections indicating a 10.67% compound annual growth rate (CAGR), reaching $10 billion by 2026.
However, with so many Gantt chart tools available today, it can be too confusing to choose the best one for your needs.
To make things easier, we’ve done the research for you. From free tools to premium platforms with advanced features, we’ve reviewed some of the most popular options on the market.
Keep reading to learn how Gantt charts have evolved, the key benefits they provide, and how to select the right tool to optimize your project management workflow.
What is a Gantt Chart?
Developed in the early 1900s by Henry Gantt, an engineer and management consultant, the Gantt chart is a horizontal bar chart designed to simplify project management. It visually maps out project tasks on a timeline, showing start and end dates, durations, dependencies, and progress.
This tool is instrumental in project planning and scheduling. By organizing tasks into horizontal bars, it provides a clear view of each task’s status and its relationship with others. Project managers can quickly identify dependencies, assess task durations, and monitor progress in real-time.
Gantt charts are particularly effective for structuring timelines and maintaining control over small to medium-sized projects. They help ensure projects stay within scope by offering a visual snapshot of stages, progress, and deadlines at a glance. This makes Gantt charts a go-to tool for efficient and organized project execution.
Why are Gantt charts necessary?
Gantt charts are essential for project management because they provide a clear, structured way to plan, track, and execute tasks. They break down complex projects into manageable parts, helping teams set realistic deadlines, allocate resources efficiently, and monitor progress. This makes it easier to create complex plans, particularly those involving multiple teams or shifting deadlines.
According to the Project Management Institute (PMI), organizations that invest in proven project management practices, like Gantt charts, waste 28 times less money than those that don’t. This means that 9.9% of every dollar is wasted due to poor project performance—that's $99 million for every $1 billion invested. This highlights the crucial role Gantt charts play in improving efficiency and minimizing resource wastage.
In addition to improving resource allocation, Gantt charts offer a high-level overview of a project, displaying key details like task start and end dates, milestones, and dependencies. Modern Gantt chart software, such as Meegle's, synthesize information and show how choices impact deadlines, making it easy to visualize potential delays and their effects on the project timeline.
Another study found that 77% of high-performing companies use project management tools to maintain clarity and alignment across teams. Gantt charts contribute to this by offering a simple visual timeline that keeps everyone on the same page, ensuring seamless communication and coordination.
With features like task dependencies and real-time progress tracking, Gantt charts empower teams to anticipate delays, address bottlenecks, and ensure successful project delivery. Their ability to centralize information makes them indispensable for both small projects and large-scale initiatives.
What is a Gantt Chart Software?
Gantt chart software is a tool used to create digital Gantt charts, making project management more efficient. It provides a clear timeline view of tasks, deadlines, and team responsibilities, helping everyone stay organized.
This software simplifies large projects by displaying all tasks and their owners on a single screen. You can easily track project progress, identify delays, and adjust project schedules as needed.
Modern Gantt chart tools go beyond basic visualization. They include features like drag-and-drop scheduling, resource management, and real-time updates. Industries like construction, software development, and event planning rely heavily on these tools to manage timelines and improve teamwork.
Now that we have a clear understanding of what Gantt charts are and the key features to look for in software, let's explore our top 8 Gantt chart software options!
The Best Gantt Chart Software in 2025
If you're short on time, quickly browse the table below to find the best Gantt chart software for your team, along with its pricing and target users.
| Tool | Best Features | Best For | Pros | Cons | Pricing |
|---|---|---|---|---|---|
| Meegle | Customizable Gantt charts, task automation, real-time calendar, project templates, reporting & analytics | Teams managing complex projects and deadlines | Flexible task management, Gantt charts, real-time tracking, automated reports | Advanced features require premium plan, Has a learning curve | Free plan, paid plans start at $8/user/month |
| Paymo | Time tracking, task management, Gantt chart view, invoicing, resource allocation | Small to medium-sized teams, service-based teams | Clean interface, easy task management, integrated time tracking, invoicing | Gantt charts are only available in the Business plan starting at $23.90/user/month | Free plan, paid plans start at $9.90/user/month |
| TeamGantt | Drag-and-drop Gantt chart, task dependencies, milestone tracking, resource allocation | Teams focused on visual project tracking | Simple Gantt chart tool, easy to use, good for visual planning | Minimal collaboration features, Higher pricing for large teams with multiple managers | Starts at $59/month/project manager |
| GanttPRO | Interactive Gantt charts, task dependencies, baselines, resource management, project templates | Teams needing detailed project schedules | Simple Gantt chart interface, excellent task tracking, clear project timeline | No free plan offered, The pricing is high for smaller teams or businesses with limited project needs | Paid plans start at $9.99/month |
| Wrike | Custom workflows, time tracking, reporting, document collaboration, Gantt chart with dependencies | Medium to large teams, cross-departmental work | Advanced task management, real-time collaboration, customizable workflows, reporting tools | No built-in tool for taking quick notes within the platform, Pricing may be too high for solo users | Starts at $9.80/user/month, with advanced plans available |
| ProjectManager | Gantt charts with dependencies, time tracking, task management, reporting, portfolio management | Project managers needing detailed schedules | Interactive Gantt chart, robust task management, customizable reports, real-time progress updates | Integration challenges with third-party apps and services, Limited customization options for reporting features | Paid plans start at $13/user/month |
| ClickUp | Customizable workflows, task dependencies, time tracking, Gantt charts, integrations with multiple tools | Teams needing high customization and integrations | Wide range of features, easy collaboration, customizable dashboards, integrations with multiple tools | Steep learning curve due to its wide range of features, Complex pricing structure | Free plan, paid plans start at $7/user/month |
| Monday.com | Customizable dashboards, Gantt charts, multiple views (Kanban, Calendar), integrations, automations | Teams needing flexibility and visual organization | Highly customizable, good for collaboration, powerful integrations, simple task management | Tiered pricing structure that increases with per-user costs for full collaboration features, Limited mobile functionality, Slow learning curve | Starts at $12/user/month, with tiered plans |
For more details on each option, keep reading!
1. Meegle
Full disclosure: Meegle is a full-fledged project management tool, and Gantt charts are just one of its many impressive features.
View time-related progress updates within your specific project using a Gantt Chart
Meegle’s Gantt view is a bar chart that illustrates time-related progress updates within your specific project. It provides a visual representation of the progress of each work item within a sprint, helping you track tasks, deadlines, and dependencies in a more structured manner. This feature is particularly valuable for project managers and teams looking to stay on top of their timelines and ensure that the project progresses according to plan.
To get started with the Gantt view, you first need to enable scheduling for your specific work items—whether Versions, Sprints, or Custom Work Items.
Once you’ve configured the scheduling feature, you can easily use the Gantt chart to manage those work items. The scheduling feature allows you to plan and track project timelines, ensuring everything is moving forward as intended.
Visually display the progress of each work item and within each sprint
The Gantt chart itself offers a highly interactive and user-friendly experience. You can manually adjust the timeline by simply dragging and dropping the schedule block to a new time slot.
If you need to update the Planned Duration (PD) of a task, you can manually re-enter it or modify the schedule without altering the PD.
Distinguish work days and holidays using the background color
One of the standout features of the Gantt chart in Meegle is the ability to differentiate workdays and holidays through distinct background colors in the date area. This makes it easier to plan around non-working days, avoiding confusion and ensuring that your timeline is realistic.
The Gantt charts also support multiple time range settings, allowing you to view your project’s timeline at different granular levels. You can switch between monthly, bi-monthly, half-year, or yearly perspective, depending on your project’s scope. This flexibility ensures that no matter the duration of your project, you can manage it efficiently and effectively.
View your project’s timeline in different time settings
By default, the "Expand All Subtasks" option is enabled, displaying all scheduling nodes and tasks within your requirements. For a streamlined view, you can select "Fold All Subtasks" to focus on high-level scheduling data, offering a concise overview of project status.
Now, that’s just the Gantt chart part of the deal. Like we said before, Meegle is more than that.
The platform also offers multiple views (other than Gantt Charts, of course) to help organize, track, and prioritize tasks according to different needs.
Track, organize, and prioritize tasks as per your project’s needs
For example:
- Table View: Organize project data in rows and columns for a clear, digestible layout. This view is perfect for teams who need to quickly sort tasks by priority or focus on specific details
- List View: Display tasks in a hierarchical format to highlight their relationships. It’s great for breaking down large projects and prioritizing tasks within the overall project timeline.
- Kanban View: Visualize tasks and manage your backlog with a Kanban view board. Ideal for teams that work with agile methodologies, it helps track progress through visual task management.
- Tree View: Provides an overall look at your project by organizing tasks in a multi-level structure. The tree view makes it easier to manage complex projects, giving you a clear overview of all tasks and their dependencies.
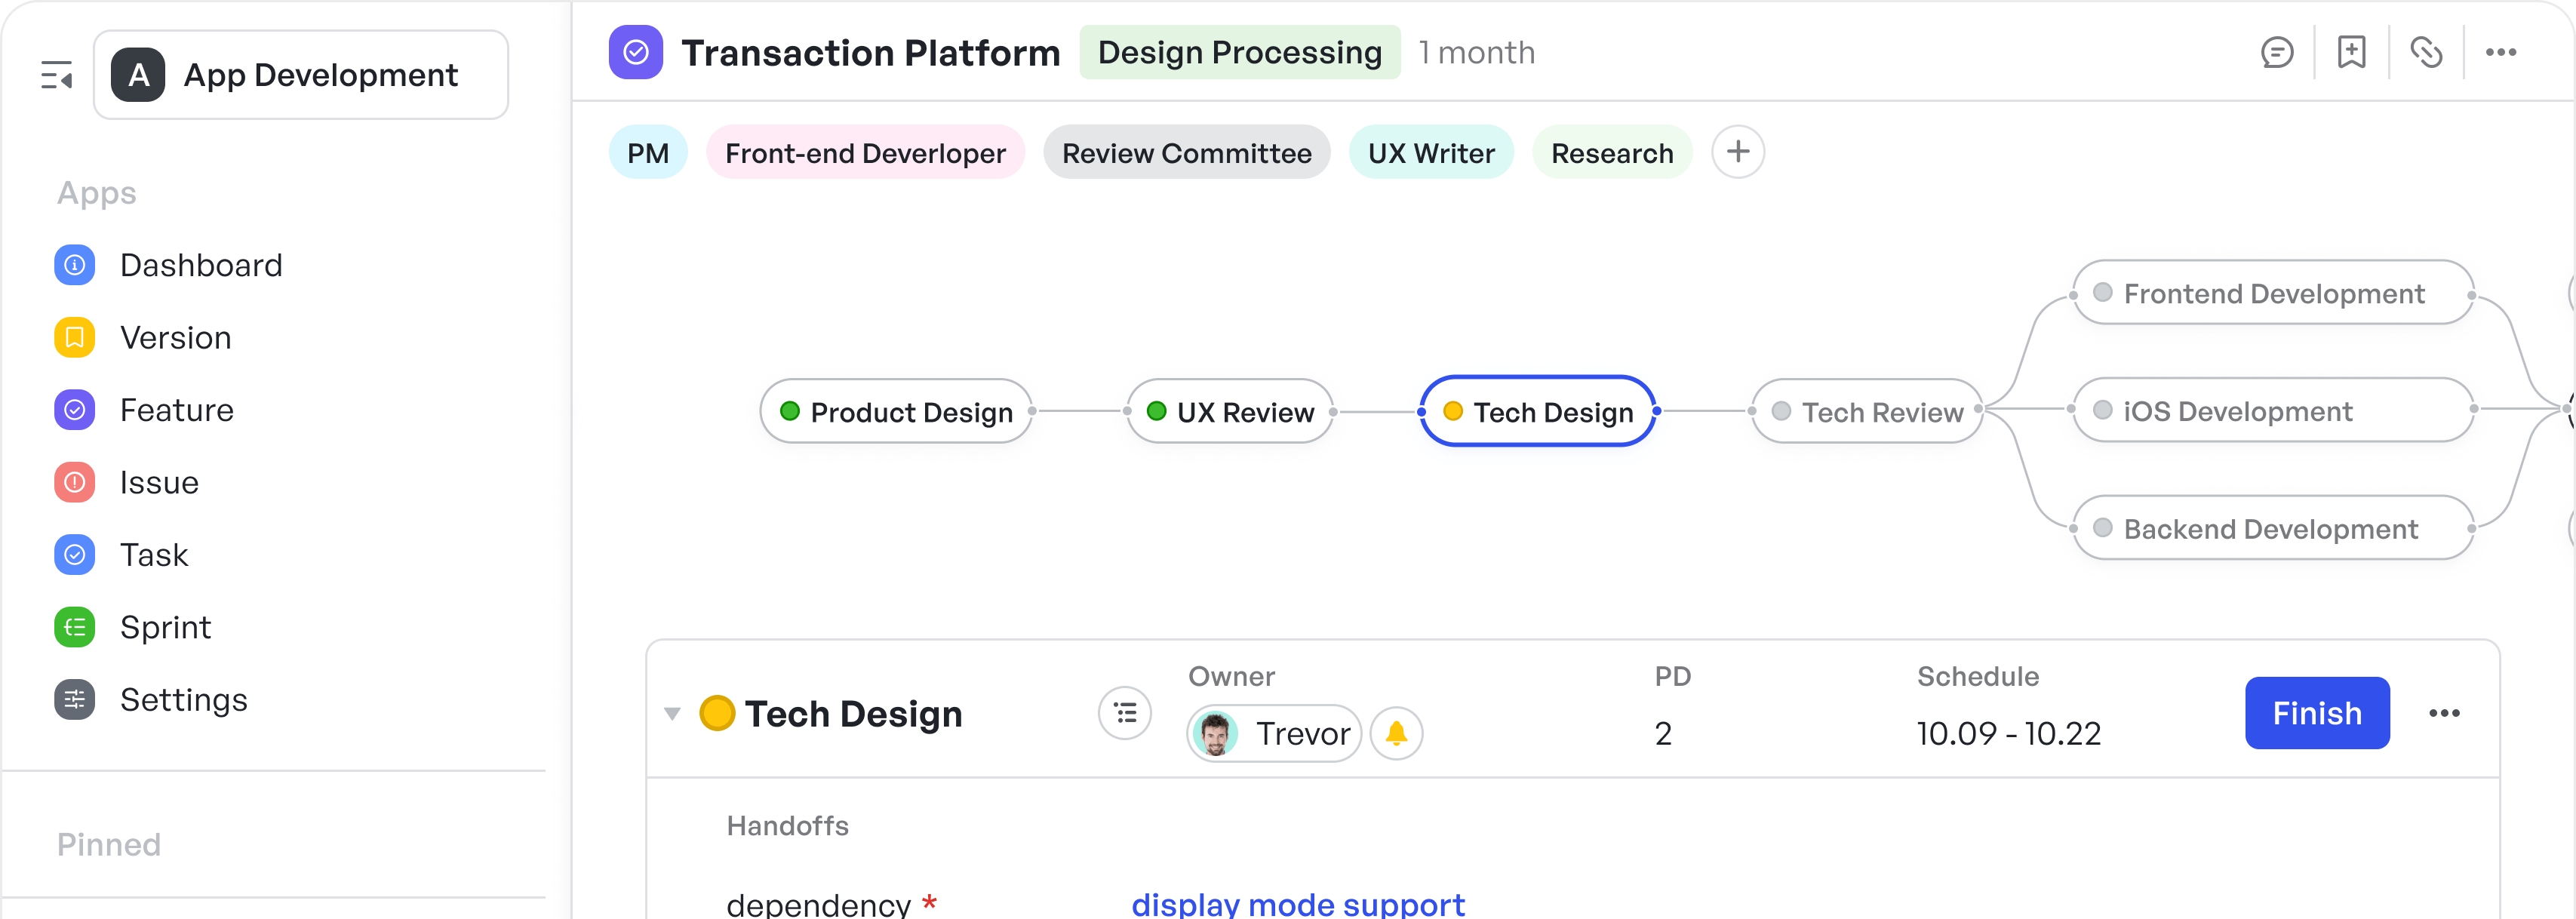
Additionally, with its node-driven workflows, teams can clearly visualize project timelines and dependencies simplifying task management across different stages.
Visualize project timelines and dependencies, from the beginning to the end
The platform also allows for a high level of customization, enabling users to break down intricate projects while keeping the big picture intact.
Whether you are managing simple or complex workflows, Meegle provides all the necessary tools to stay organized, communicate progress, and maintain control over your projects.
Meegle's Best Features
- Track project progress with ease through Gantt charts and real-time updates.
- Choose from multiple visual formats like Table, List, Kanban, and Gantt views for project insights.
- Break down intricate projects into manageable parts using the hierarchical Tree View.
- Streamline workflows by utilizing visual, node-based task management for better organization.
- Create task dependencies to ensure a smooth, logical sequence of project activities.
Meegle's Pros
- Promote cross-team collaboration with clear, interconnected workflows and task dependencies.
- Boost team accountability by assigning tasks with clear ownership and progress tracking.
- Increase productivity through automated scheduling that adapts to shifting timelines.
- Tailor dashboards to track the most relevant data, making it easy to stay on top of project milestones, resources, and deadlines.
Meegle's Cons
- Access to advanced features may require upgrading to a premium plan.
- The learning curve may be steep for users managing complex projects.
Pricing
- Standard: $8/month per user
- Premium: $12/month per user
- Enterprise: Custom pricing
Best For
Meegle is suitable for both small teams and large organizations managing increasingly complex projects.
2. Paymo
Gantt chart from Paymo showing color-coded bars along a timeline with dependencies indicated by connecting arrows
If you’re looking for a budget-friendly project management tool that supports Gantt Charts, Paymo is your go-to solution. Designed for small teams of up to 20 people, Paymo covers all the essential project management tasks like managing client work, tracking time, invoicing and measuring profitability. Plus, it offers a solid Gantt chart feature to help you stay on top of your project timelines.
One of the best features Paymo offers is its automatic timeline generator. That is, when you set a task’s start and end date, it’s automatically added to your timeline. Of course, you still have the flexibility to manually adjust task durations if needed. This is a great option for anyone looking to replace spreadsheets with an intuitive, simple Gantt chart generator.
Another great advantage is the low learning curve. You’ll quickly get the hang of it and be able to use it effectively right away.
From a planning perspective, Paymo allows you to link tasks and milestones using dependencies. This helps you visualize which tasks need to be completed before others can start. You can also account for delays and overlaps, which is especially helpful for project managers working with cross-functional teams.
Paymo Best Features
- Visualize broken dependencies clearly.
- Track time and invoice clients within the same platform.
- Create and modify tasks easily with drag-and-drop functionality in Gantt charts.
- Enjoy a fresh and calming UI design.
Paymo Pros
- Streamline invoicing by simplifying the creation and sending of invoices.
- Set automatic reminders for unpaid invoices to ensure timely payments.
- Access an easy-to-navigate setup with a simple interface, suitable for all technical expertise levels.
- Get a complete project overview and actionable insights with Paymo’s dashboards.
- Integrate seamlessly with existing tools and business processes without disrupting workflow.
Paymo Cons
- Gantt charts are only available in the Business plan, starting at $23.90/user/month.
Pricing
- Free
- Starter: $9.90
- Small Office: $15.90/user/month
- Business: $23.90/user/month
Best for
Teams that need strong invoicing capabilities and Gantt chart features.
3. TeamGantt
TeamGantt charts software showing progress percentages on tasks and color-coded bars on timelines to reflect task durations
Another excellent choice for managing project schedules is TeamGantt. It offers a simple and clear way to manage tasks, timelines, and team assignments. What really makes TeamGantt stand out is the fact that it taps into the core principles of project management and reflects them in its design. The platform gives you a comprehensive view of your project, showing tasks, deadlines, and resources all in one place.
The interactive Gantt charts are easy to use and very intuitive. Anyone on your team can quickly get up to speed, and if they need help, there’s plenty of tutorial content available. The tool’s simplicity makes it accessible to all team members, regardless of experience.
However, TeamGantt does have its limitations. It doesn’t include budgeting or invoicing features, and the reporting tools are fairly basic. Additionally, collaboration features like discussions, file uploads, and notifications aren’t as robust as you might expect from a comprehensive project management platform.
TeamGantt Best Features
- Create, edit, and update tasks with simple drag-and-drop functionality within Gantt charts.
- View all projects in a single screen, making it easy to track progress and switch between them.
- See each team member’s workload and availability for easier task assignment.
- Organize tasks with helpful categorization and organization tools.
- Manage projects on the go with a dedicated mobile app for iOS and Android.
TeamGantt Pros
- Organize all project-related details such as timelines, milestones, team members, and resources with ease.
- Assess project progress visually at a glance, showing how much is complete and what remains.
- Automate resource planning to simplify task allocation and capacity management.
- Manage individual and team workflows by assigning tasks, setting deadlines, and tracking progress.
TeamGantt Cons
- Limited reporting and budgeting features, making it hard to create detailed project reports.
- Minimal collaboration features compared to other project management tools.
- Higher pricing for larger teams with multiple managers.
Pricing
- Pro: $59/month per manager
- Unlimited Everything: Custom Pricing
Best for
Small to medium teams looking for a powerful scheduling tool with basic collaboration features.
4. GanttPRO
GanttPRO chart showing organized listing of tasks, assigned team members, and task statuses.
When you start using GanttPRO, you'll immediately notice its highly detailed Gantt chart layout. This design allows you to fit a lot of information on a single screen, which is perfect for project managers who need to stay on top of every task, deadline, and resource.
GanttPRO also offers a robust workspace where you can manage multiple projects, each with its own set of tasks. You can easily add tasks with a simple drag-and-drop function, making it easy to get started right away. This feature helps you quickly track progress, identify which tasks are in progress, and see who’s handling what. While some might appreciate this level of detail, others may find it overwhelming or cluttered.
Additionally, GanttPRO supports importing and exporting project data, allowing you to import from CSV files or Jira. For sharing, you can create a secret link to send to stakeholders, or export your project as a PDF, PNG, or CSV file.
GanttPRO Best Features
- Visualize and manage team workloads to avoid overburdening any member.
- Use the board view to manage tasks with a Kanban-style interface.
- Collaborate seamlessly with features like comments, task mentions, and file attachments.
- Set up notifications for upcoming deadlines and task assignments.
- Respond to changes in real time with dynamic Gantt charts.
GanttPRO Pros
- Enjoy a user-friendly interface that’s easy to navigate, even for new users.
- Save time with ready-made professional templates that can be customized.
- Get access to 24/7 technical chat support whenever needed.
- Define task dependencies and create task hierarchies to ensure timely project completion.
GanttPRO Cons
- No free plan available.
- The pricing is high for smaller teams or businesses with limited project needs.
- Occassional update delays can cause project workflow disruptions.
Pricing
- Basic: $9.99/month per user
- Pro: $15.99/month per user
- Business: $29.99/month per user
- Enterprise: Custom pricing
Best for
Medium to large teams seeking a detailed and robust Gantt chart solution for project management.
5. Wrike
Wrike Gantt chart software shows a stacked bar chart displaying project distribution by team members across statuses.
Designed with simplicity in mind, Wrike offers a simple solution to help you keep everything in order. Its table view displays everything you need at a glance—task names, assignees, start and end dates—all clearly laid out. This design makes it easy to track your progress without sifting through layers of data.
Additionally, its Workload View shows responsibilities and progress of team members, so you can quickly assess who's overburdened or falling behind.
It also makes collaboration simple, with real-time adjustments to tasks and minimal need for long meetings. Everyone stays in sync, no matter what changes occur.
Wrike Best Features
- Kickstart projects with simple request forms for streamlined workflows.
- Organize tasks using Spaces, folders, tasks, and subtasks for clear structure.
- View progress in various layouts like Calendar, Kanban, Table, Gantt, and Workload.
- Manage stakeholders with cross-tagging, live document editing, and proofing features.
- Collaborate effortlessly with the powerful proofing tool for commenting on PDFs, videos, and more.
Wrike Pros
- Boost visibility with detailed reports on workloads and project status.
- Save time with customizable project templates for recurring tasks or similar projects.
- Manage tasks easily by assigning them to team members and external partners.
Wrike Cons
- No built-in tool for taking quick notes within the platform.
- Pricing may be too high for solo users or small teams needing advanced features.
- Some integrations, like Outlook, can cause notifications to be delayed by over an hour.
- The task filter hides completed tasks, requiring manual adjustment.
- You’ll need third-party apps like Slack to manage team communication.
Pricing
- Free
- Team: $9.80/month per user
- Business: $24.80/month per user
- Enterprise: Custom pricing
- Pinnacle: Custom pricing
Best for
Medium-sized companies to enterprises that need a full suite of project management features across multiple departments
6. ProjectManager
ProjectManager Gantt chart software representing dependencies with lines connecting assigned task bars
If you're just getting started with Gantt charts, ProjectManager is a great place to begin. It's one of those tools that truly understands what makes Gantt charts effective. With it, you can plan, schedule, set milestones, and assign tasks—all in a visually intuitive way.
You can also import, export, and share your project files, including those from Microsoft Project. Plus, collaboration is built right in, allowing teams to comment directly on tasks. It also link tasks together and ensure your project stays on track with just a simple drag-and-drop action. This eliminates delays and ensures that everything happens in the right order.
Another feature of ProjectManager that users love is its ability to identify the critical path without complicated calculations. With just one click, you can pinpoint the most essential tasks, helping you stay within budget and meet deadlines.
Once your schedule is set and all your tasks and resources are in place, you can establish a baseline. This captures your project plan and tracks how things are progressing in real time. You’ll see exactly how your current progress compares to your original plan. If things aren't going as expected, you can adjust the scope, costs, or timeline to keep things on course.
ProjectManager Best Features
- Create interactive and visual Gantt charts to plan your projects online.
- Organize all project details in a centralized, easy-to-navigate location.
- View dependencies, milestones, project status, and the critical path all in one place.
- Schedule tasks easily using drag-and-drop functionality and color-coded labels.
- Collaborate effectively through file sharing, task commenting, and automated notifications.
ProjectManager Pros
- Easy drag-and-drop scheduling for smooth task management.
- Real-time project tracking with clear visibility on tasks, resources, and milestones.
- Critical path analysis to focus on essential tasks and avoid delays.
- Customizable reports to fit your team’s unique needs and improve decision-making.
ProjectManager Cons
- Integration challenges with third-party apps and services.
- Limited customization options for reporting features.
Pricing
- Team: $13/month (billed annually)
- Business: $24/month (billed annually)
- Enterprise: Custom pricing
Best for
Solution architects with experience in project management tools, especially Gantt Charts.
7. ClickUp
ClickUp Gantt chart visually showing tasks and dependencies with customizable options
Unlike many other platforms that offer limited Gantt functionality without proper support, ClickUp gives you the full Gantt experience. You get access to 60 uses of the Gantt chart feature before upgrading—enough time to see if it's a good fit for your needs.
The Gantt charts in ClickUp are highly detailed, allowing you to edit tasks, set dates, assign team members, and track timelines. You can even add descriptions and custom fields like dropdowns, text areas, labels, progress updates, and AI-generated summaries to each task.
One cool feature is the AI writer, which can help you draft descriptions and project summaries. It’s a handy tool, though you might need to tweak the results a few times to get them just right.
ClickUp Best Features
- Visualize projects in Gantt charts, timelines, lists, calendars, and ClickUp Kanban boards.
- Link task dependencies and automatically schedule tasks across multiple stages in one click.
- Drag and drop tasks to update statuses and define custom task statuses.
- Track time spent on tasks with ClickUp's built-in time tracking.
- Centralize information in a hierarchy of spaces, projects, lists, tasks, and subtasks.
- Collaborate easily with comments, @mentions, and task updates.
Clickup Pros
- Customizable workflows to fit your team's unique processes.
- User-friendly interface with a clean, organized dashboard.
- Detailed reporting with customizable export options.
- Third-party integrations with tools like Slack, Google Drive, and Zapier.
Clickup Cons
- Steep learning curve due to its wide range of features.
- Limited customer support (email and chat only, no phone support)..
- Complex pricing structure with multiple tiers.
- Can become cluttered with too many users.
Pricing
- Free forever
- Unlimited: $7/month
- Business: $12/month
- Enterprise: Contact for pricing
- ClickUp Brain: Add to any paid plan for $7 per Workspace member per month
Best for
Teams and businesses of all sizes that need a flexible, feature-packed project management tool.
Read More: Meegle vs. ClickUp
8. Monday.com
Monday.com Gantt chart interface showing a search/filter option, a button to add new tasks, and a progress overview
What makes Monday.com a fan-favorite is how customizable and flexible it is, especially when it comes to managing your data and tasks.
Even on the free plan, you can create custom dashboards with different views like Kanban boards, calendars, and board views that fit your team's workflow. Plus, its Gantt chart dashboard allows you to add widgets like pie charts, progress bars, and file galleries, creating an all-in-one, visually appealing view of your project.
Monday doesn’t stop at customization—it offers a range of integrations through its "power-ups," giving you the ability to connect with tools like Outlook, Google Calendar, and DocuSign. Plus, there's an app marketplace that expands your options for further integration.
But, as powerful as Monday is, it can be on the expensive side. And honestly, if you're running a small team with simple projects, it may feel like overkill.
Monday.com Best Features
- Automate workflows with Monday AI to streamline project tasks.
- Customize Gantt charts with over 30 widgets for a personalized dashboard.
- Embed external project management tools directly into your Gantt charts for full visibility.
- Switch between views like lists, Kanban boards, and timelines for better task management.
- Manage tasks and resources effectively to align goals and ensure project success.
Monday.com Pros
- Collaboration-friendly with multiple users editing the same list and messaging each other.
- Great tracking capabilities with visual boards, color coding, and easy task progress monitoring.
- Timeline view for tracking deadlines and milestones, even without a Gantt chart.
- Effective communication tools to invite guests and keep all team members in the loop.
- Organizes resources and schedules in a clean, accessible workspace with automation options.
Monday.com Cons
- Tiered pricing structure that increases with per-user for full collaboration features.
- Time and expense tracking can be difficult to manage for some users.
- Cluttered interface with a steep learning curve, especially for new users.
- Limited mobile app functionality, particularly for iPhone users, and missing equivalent views.
Pricing
For 3 to 49 seats:
- Free
- Basic: $12/month per seat
- Standard: $14/month per seat
- Pro: $24/month per seat
- Enterprise: Custom pricing
Best For
Smaller teams, freelancers, and independent users rather than large enterprises, due to the limited capacity of its project scheduling features.
Also Read: Monday.com Alternatives & Competitors in 2025
Benefits of Using Gantt Chart Software
Gantt chart software provides numerous advantages, making it indispensable for effective project management. Below are some of the most common benefits of using these tools:
1. Simplified project planning
With Gantt chart software, teams can create timelines that outline task dependencies, set realistic deadlines, and monitor progress at every stage.
For example, when planning a product launch, a marketing team could use a Gantt chart to connect campaign phases—like content creation, promotion, and analytics—ensuring everything leads smoothly to the release date. This method improves task sequencing, helping teams anticipate challenges and stick to deadlines.
2. Enhancing collaboration through shared access
Real-time collaboration is vital for effective teamwork, and Gantt chart tools provide shared access to project timelines. Team members can update tasks, track progress, and adjust priorities seamlessly. For a software development team, this shared view enables coding, testing, and deployment stages to move forward without miscommunication.
Moreover, transparency helps departments work together efficiently, reducing delays caused by unclear updates.
3. Automating updates for improved accuracy
Automation reduces the risk of manual scheduling errors. When one task’s status changes, Gantt chart software updates dependent tasks instantly.
For instance, in construction projects, a delay in material delivery automatically adjusts timelines for related activities, such as installation and inspection. This capability ensures accuracy in project schedules, minimizing disruptions and mismanagement.
4. Resource optimization
Workload visibility allows managers to allocate resources where they’re most needed. Gantt chart software identifies overburdened team members and reallocates tasks to prevent burnout.
For instance, event planners benefit from this feature by balancing staff assignments across multiple events, ensuring every task is handled efficiently without overburdening individuals.
Effective resource management also improves overall team productivity and job satisfaction.
5. Low-cost project management
Last but not least, Gantt chart tools provide cost-effective solutions for teams of all sizes. Free options cater to smaller organizations, while paid plans offer advanced features for larger enterprises.
A startup using a freemium Gantt chart tool can coordinate projects effectively while staying within budget. This approach helps manage resources, timelines, and deliverables without investing in expensive software during the early stages of growth.
Criteria for Choosing Gantt Chart Software
With so many options available, picking the right Gantt chart software can be too confusing. However, focusing on these key factors will make the decision easier.
Let’s take a look at these features.
- Ease of use: Choose software with a user-friendly interface and user-friendly design to minimize training time and boost team adoption.
- Customization options: Opt for tools that allow for tailored views, task labels, color-coding, and custom fields to match your project workflows. Customizable templates also help simplify setup for different project types.
- Integration capabilities: Ensure the software can seamlessly integrate with other project management, communication, and file-sharing tools like Slack, Google Drive, and Jira. This reduces siloed information and enhances workflow continuity.
- Real-time collaboration: Look for software that offers live updates, task commenting, and notifications to keep all team members on the same page in real time
- Resource management: Choose platforms with features to track resource allocation, identify overbooked team members, and optimize workload distribution
- Task dependencies: Make sure the software supports dependency mapping, so tasks are linked and any delays are automatically updated across the schedule
- Reporting and analytics: Select software that provides in-depth, customizable reports and visual dashboards to track progress, resource usage, and milestones. Data insights also help with proactive issue resolution and decision-making.
- Mobile access: Ensure the platform offers a mobile app or responsive design, allowing team members to update tasks, track progress, and view Gantt charts from anywhere.
- Support and training: Look for vendors who offer comprehensive onboarding, detailed documentation, and 24/7 customer support. Access to knowledgeable support can resolve issues quickly.
- Cost: Evaluate the pricing model to ensure the tool provides value based on its features. Consider total costs, including subscriptions, add-ons, and potential integration fees.
Gantt Chart Alternatives
If you find Gantt charts limiting, consider these three alternatives for project planning. Each has unique strengths, depending on the complexity and type of your project.
PERT Chart (Best for Complex Projects with Detailed Critical Path Analysis)
The PERT chart (Program Evaluation and Review Technique) is designed for projects that involve many interdependent tasks and require precise scheduling. It is particularly useful for large, complex projects where timing is critical, and the relationships between tasks need to be clearly defined.
In a PERT chart, tasks are represented as nodes, and arrows show the dependencies between them. This structure makes it easier to identify the critical path, which is the sequence of tasks that determines the overall project duration.
Best for:
- Projects with uncertain timelines where task duration is variable and must be estimated.
- Large, cross-functional projects with numerous steps that need careful coordination.
- Managing complex dependencies between tasks and understanding the project's overall time constraints.
For example, in product development or construction projects, where various tasks depend on one another, the PERT chart helps to visualize the impact of delays and manage resources effectively.
Kanban Boards (Best for Visual Task Management and Agile Workflows)
Kanban boards offer a visual representation of your project’s tasks and their status. Tasks are displayed as cards, which are moved through stages such as To-Do, In Progress, and Completed. This format provides an easy-to-understand visual cue of the task flow, making it a great choice for teams who prioritize flexibility and continuous progress.
Kanban boards are especially beneficial for agile workflows. Teams can use them to break down work into smaller tasks that can be completed in short cycles, also known as sprints. As tasks progress through the board, it becomes clear where bottlenecks are occurring, allowing teams to quickly adjust.
Best for:
- Agile teams that require a flexible, iterative approach to task management.
- Projects where priorities change frequently and tasks can be broken down into smaller, manageable steps.
- Teams that need to collaborate in real-time and require constant updates to task status.
For instance, software development teams often use Kanban to visualize features or bugs that need to be developed or fixed. The board keeps all team members aligned on priorities, helping them adjust quickly as new tasks come up or priorities shift.
Calendars (Best for Simpler Scheduling and Time-Based Projects)
Calendar views are the most straightforward alternative, especially when your project is simple and doesn’t involve complex dependencies. A calendar allows you to assign tasks with specific start and end dates, track deadlines, and monitor progress without the need for detailed task mapping. It’s a simple yet effective tool for managing projects where timing and deadlines are the primary concern.
While Gantt charts provide a detailed visual of the project timeline, calendars offer a much simpler, date-based perspective. They work best when you need to schedule meetings, set clear due dates, or track important milestones.
Best for:
- Smaller projects with fewer dependencies and straightforward task deadlines.
- Teams that only need to track task dates, milestones, or recurring events.
- Projects where detailed task dependencies and timelines are less critical.
For example, if you are organizing a marketing campaign with a few deadlines spread across the month, a calendar will let you easily track when each task should be completed. This view is simple yet robust, making it ideal for individuals or teams who just need to schedule and monitor high-level activities.
How Meegle Fits into Gantt Chart Software Needs
With countless Gantt chart tools out there, choosing the right one can be a challenge. If you’re juggling multiple projects and need a tool that’s both flexible and packed with powerful features, Meegle is worth considering. It allows you to create Gantt charts in minutes, even for the most complex projects.
Getting started with Meegle is simple, thanks to its extensive template library. You can easily import your project data from Excel or other platforms, saving you time and effort. Along with robust Gantt charts, Meegle offers many additional features to keep your projects on track.
Easy task management
Effective task management is key to keeping a project on schedule. Meegle makes task definition easy, which is essential for Gantt charts. You can quickly import task lists from spreadsheets or use ready-made templates to set up tasks.
Handle all tasks easily with Meegle’s task management feature
Once tasks are outlined, you can set durations, due dates, and assign them to team members. These tasks are then mapped on a Gantt chart, providing a clear visual timeline. This feature helps with Agile development, making it easier to track progress and adjust tasks as needed.
Get access to builtin templates
Stay on top of every project phase, from initiation and planning to execution, monitoring, and closure
The Project Life Cycle Template in Meegle ensures your project stays organized throughout all phases. You can define tasks in each project stage—from initiation to planning, execution, and closing—while mapping them on the Gantt chart. This approach gives a clear overview of the entire project, making it easier to adjust deadlines and resources.
Real-time calendar integration with Gantt Charts
Meegle offers real-time calendar management, which directly supports your Gantt charts. You can track team availability, including holidays and time off, and factor these into the project timeline. This integration ensures your Gantt charts reflect realistic deadlines.
Ensure everyone’s availability is accounted for with Meegle’s Calendar View
By adding global or local holiday settings, you can ensure your schedule is always accurate. As team schedules change, Meegle’s member schedule updates in real time, adjusting task assignments and timelines as needed. This functionality keeps your Gantt charts organized and conflict-free.
Meegle’s Gantt chart view also helps you plan out your entire project timeline, offering a visual snapshot of your project pipeline. This makes it easier to see upcoming tasks and adjust timelines for better project flow.
Read More: Empowering Communities: How Meegle Strengthens Nas Daily's Technology Backbone
Reporting and analytics for Gantt Chart tracking
Meegle’s reporting tools integrate with Gantt charts to track important project metrics like time, cost, and workload. The real-time dashboard offers clear charts and graphs that show your project’s progress.
Get a high-level view of task progress and track key metrics like time, cost, and workload
This data allows you to stay on top of potential issues and adjust your Gantt chart accordingly. By tracking key metrics directly in the dashboard, you can quickly spot areas that need attention and keep the project on track. This feature is essential for proactive project management and successful project completion.
With these features, Meegle ensures that managing your projects with Gantt charts is both efficient and effective, helping you stay on track and meet deadlines.
Make Your Projects More Organized and Efficient with Meegle's Gantt Charts
Managing tasks without a clear plan can feel like trying to assemble furniture without instructions—confusing and frustrating. Gantt charts act as your visual architects, clearly outlining tasks, deadlines, and dependencies so your team knows exactly what needs to be done.
And if it gets too overwhelming, Meegle has you covered up with its powerful Gantt charts that provide clear, visual roadmaps. You can easily map out tasks, timelines, and dependencies, ensuring everyone is on the same page.
Plus, Meegle automates time-consuming tasks like sending deadline reminders and updating progress, saving you time. This allows your team to focus on more important tasks, like strategy and creative problem-solving.
Start for free today and see how it can transform your project management!
FAQs
What is the best software for making Gantt charts?
The best software for creating Gantt charts depends on your specific needs. For advanced features and team collaboration, tools like Meegle, monday.com, Wrike, and Asana are highly recommended.
Can Excel do Gantt charts?
Yes, Excel can create basic Gantt charts by manually formatting a bar chart. However, it lacks some advanced features that dedicated project management software offers, like task dependencies, resource allocation, and real-time updates.
Is there a Microsoft Gantt chart?
Microsoft offers Microsoft Project, which includes Gantt chart capabilities for project planning and management.
Is there a free Gantt chart software?
Yes, several Gantt chart tools offer free versions. Meegle, Trello, Asana, and ClickUp provide basic Gantt chart functionalities at no cost.
The world’s #1 visualized project management tool
Powered by the next gen visual workflow engineRead More
Check All BlogsStart creating impactful work today