Key Agile Metrics & KPIs for Measuring Team Performance


Agile is one of the most popular project management frameworks, especially because it offers the flexibility a modern day project needs. It allows you to deliver value consistently while keeping up with changes in priority and environment. But even with all the flexibility, you need to ensure that your team is truly making the kind of progress you want. And you can do that with Agile methodology and its metrics and key performance indicators (KPIs).
Take velocity, for example. It’s a great way for teams to gauge their work capacity across sprints. By tracking the number of story points completed in each sprint, teams can refine their planning and set achievable goals. Then there’s cycle time, a KPI that measures how quickly work moves from start to finish. A steady cycle time helps project and product managers ensure a consistent flow of deliverables, keeping teams on track and continuously improving performance.
There are several other such metrics and KPIs which offer invaluable data on your team's performance. This blog aims to highlight some of the most essential ones, showing how they bring clarity to workflows, strengthen collaboration, ensuring every effort contributes to meaningful progress.
What are Agile metrics and KPIs?
 Measure the right metrics with Meegle
Agile metrics and KPIs are measurable indicators that help teams track progress, efficiency, and overall performance within an Agile framework. Metrics like velocity and cycle time offer insights into workflow patterns. While KPIs such as lead time help teams maintain a steady rhythm, ensuring each deliverable reaches stakeholders at the right moment.
The list of Agile metrics and KPIs is extensive; some provide a direct view of team performance, while others highlight areas for refinement. Let's take a look at both.
Agile metrics and KPIs that directly measure team performance
Velocity metrics
- Sprint velocity – Tracks how much work a team completes per sprint
Formula: Sum of Story Points Completed / Number of Sprints
Sprint velocity measures how much work a team completes per sprint, giving a clear picture of team stability. Managers can track velocity trends over multiple sprints to spot patterns. A steady velocity means the team is working efficiently, while shifts in velocity highlight opportunities to refine workflows, balance workloads, or streamline processes.
For example, a development team completes 100 story points across four sprints, making their sprint velocity 100/4 = 25 points per sprint. With this insight, managers can plan ahead with confidence. If a new feature requires 50 story points, they know it will take about two sprints to complete. This keeps timelines realistic and ensures smooth project execution.
Sprint metrics
- Sprint burndown – Measures work completed vs. total planned work in a sprint
Formula: Remaining Work = Initial Scope - Completed Work
Sprint burndown measures progress by tracking completed work against your total sprint plan. If your team starts with 60 story points and completes 30 points by Day 5, it shows that they’re progressing efficiently. However, to maintain this momentum, you need to look at the burndown chart daily and check if the work is being completed evenly.
 Burndown charts in Meegle
If progress slows mid-sprint, look at task complexity or dependencies that might need adjustment. If most work is completed at the end, consider breaking tasks into smaller increments to spread effort more consistently. You can keep your team’s workload balanced and ensures steady progress throughout the sprint.
- Sprint planning accuracy – Compares estimated work to actual work completed
Formula: Commitment Reliability = Completed Stories / Planned Stories
Sprint planning accuracy measures how well your team estimates and completes planned work. Tracking this helps you refine future sprints and match workload to capacity.
Say your team plans 20 stories and completes 18—an accuracy of 90%. This tells you their estimates are solid and aligned with real capacity. If accuracy dips below 70%, review estimation methods by breaking down tasks further or adjusting story point sizing. If it’s consistently above 95%, your team might be playing it safe. Consider increasing workload slightly to maximize efficiency without overloading them. Like all other metrics, this one too helps your team be consistently productive.
Capacity metrics
- Team capacity – Calculates the team’s available productive hours
Formula: (Available Hours - Non-Project Time) × Team Size
Team capacity measures how much productive time your team has each week, helping you plan work effectively.
Take a six-person team working 8-hour days, with 2 hours in meetings. Their weekly capacity is (8-2) × 5 × 6 = 180 hours. To make the most of this time, compare actual work completed to available hours. If output falls short, check for frequent context switching, long review cycles, or unplanned work eating into focus time. Adjust schedules, limit ad-hoc tasks, or streamline approvals to keep work moving efficiently. Tracking this metric helps you allocate tasks realistically and keep productivity strong.
Efficiency metrics
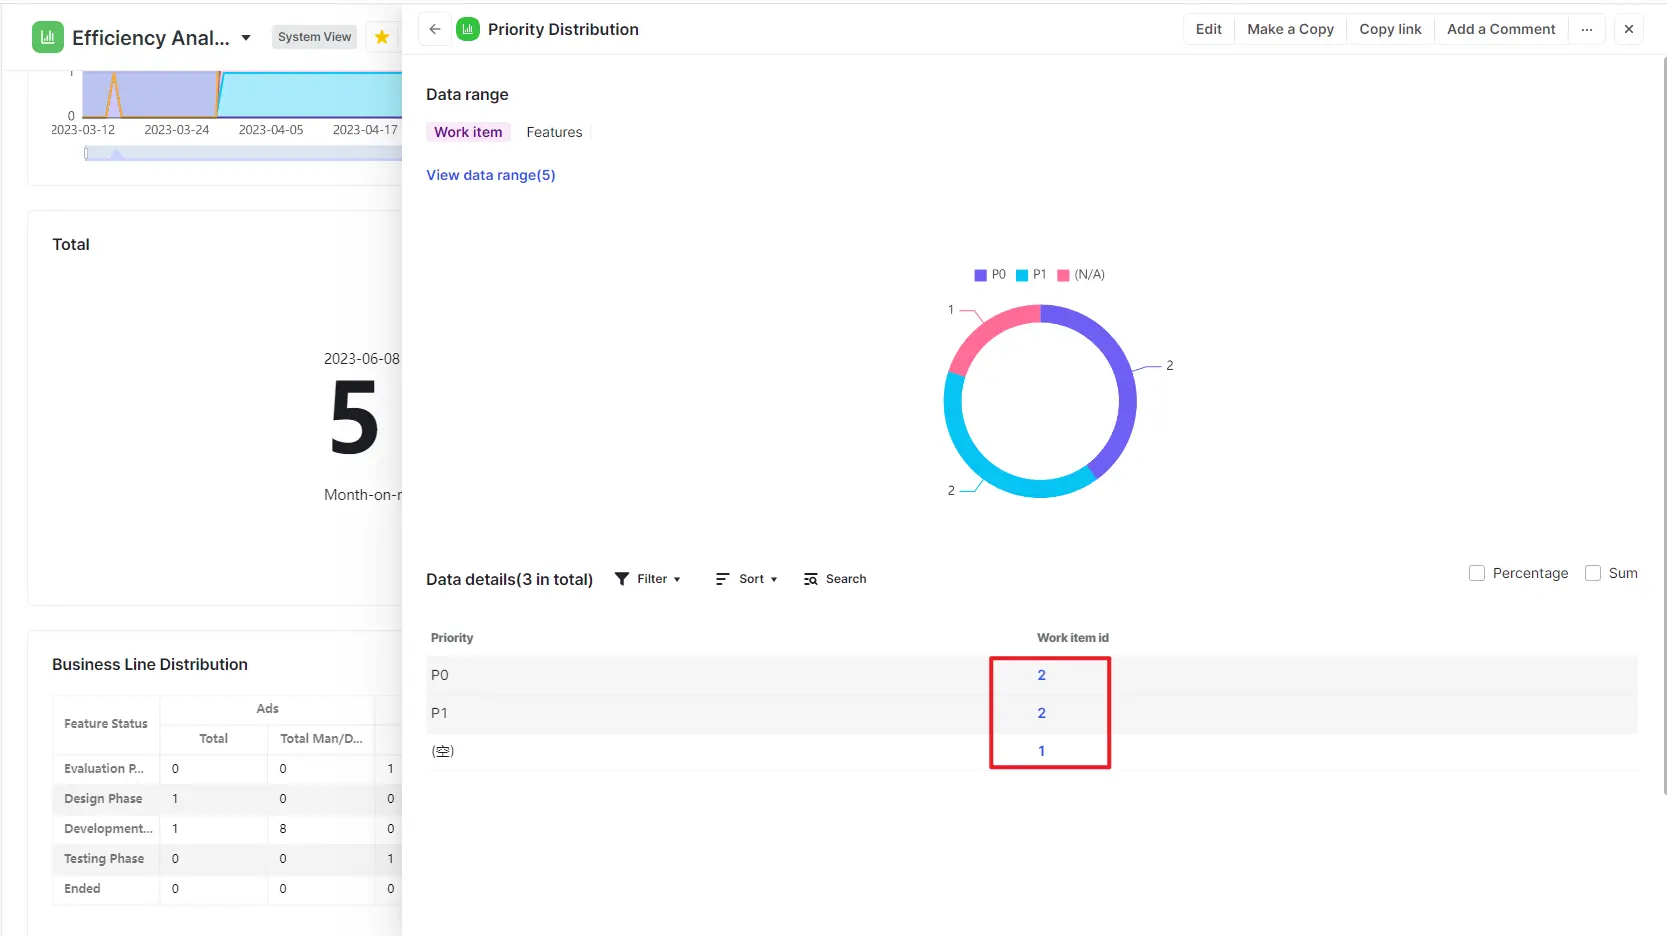
 Efficiency analysis using Meegle's charts
- Flow efficiency – Measures how much of the total time is spent actively working
Formula: Value-Add Time / Total Time
Flow efficiency shows how much of your team’s time goes into actual work versus waiting. Tracking this helps you spot delays and keep projects moving.
If a feature takes 10 days to complete, with 6 days spent on development and testing. Flow efficiency is 6/10 = 60%, meaning 40% of the time is spent waiting. If efficiency drops below 50%, look at where work stalls. Are approvals taking too long? Are tasks piling up in review? Are too many work items in progress at once? Streamline approvals, set WIP limits, or adjust workflows to keep tasks flowing smoothly. Small changes here free up more time for actual work and keep delivery on track.
 Meegle's Delay Label feature helps monitor workflow efficiency
- Work item age tracking – Monitors how long tasks take in different workflow stages
Formula: Current Date - Start Date of Work Item
Work item age tracks how long tasks stay in different workflow stages, helping you keep projects on pace.
Consider this: a feature has been in testing for 10 days while similar ones wrap up in 5. That’s a signal to look closer. Check if testing is overloaded, approvals are slow, or defects are creating rework. Track patterns across multiple sprints, if items consistently stall in one phase, adjust resource allocation or streamline reviews. Shifting resources or speeding up reviews keeps work moving and avoids slowdowns.
Process health metrics
 Throughput analysis in Meegle
- Throughput – Counts the number of completed tasks in a set time
Formula: Completed Items / Time Period
Throughput measures how many tasks your team completes in a set time, helping you track progress and set realistic goals.
Say your team delivers 30 features in a month. By monitoring this over time, you can see trends and adjust workloads accordingly. If throughput is rising, efficiency is improving, look at what’s working and reinforce those habits. If it starts dipping, check for shifting priorities, heavier workloads, or process slowdowns. Aligning work with capacity and making small adjustments keeps output steady and predictable.
- WIP (Work in progress) analysis – Ensures teams are working on the right number of tasks at a time
Formula: Number of Active Work Items / Team Size
Work-in-progress (WIP) limits help your team stay focused by capping the number of tasks they handle at once.
 WIP trend in Meegle
A five-person team managing 20 active tasks when their WIP limit is 15 may need to shift priorities. Checking WIP regularly helps you spot when work is piling up. If too many tasks are open at once, focus can get diluted. Encourage the team to complete tasks before taking on new ones, ensuring steady progress without overload. Maintaining a balanced workload accelerates task completion and keeps workflows seamless.
 View task prioritization in Meegle Charts
Quality metrics
Tracking quality keeps work efficient and minimizes rework.
- Defect density – Measures the number of defects relative to the size of a feature
Formula: Defect Density = Number of Defects / Size of Feature
Defect density shows how many defects exist relative to the size of your feature. Tracking this helps you maintain quality and catch patterns before they affect performance.
If your new checkout feature has 5 defects in 1000 lines of code, the defect density is 0.005 defects per line. If you see defect density rise after certain releases, dig into the cause. Review testing processes, strengthen peer code reviews, or adjust development timelines to catch issues earlier. Lower defect density means fewer production fixes, smoother deployments, and a more efficient team.
- Defect resolution time – Measures how long it takes to fix defects
Formula: Defect Resolution Time = Total Fix Time / Number of Defects
Defect resolution time measures how quickly your team fixes issues, keeping development on track and reducing disruptions.
For example, if your team resolves 10 defects in 20 hours, that’s an average of 2 hours per defect. Track this over time. If resolution time increases, check if defect prioritization is clear or if developers need better debugging tools. Adjust workflows so that high-priority issues get immediate attention. Faster resolution keeps bottlenecks away, streamlines releases, and lets the team focus on building instead of fixing.
Agile metrics and KPIs that indirectly improve team performance
Customer-centric metrics
These metrics reflect how well teams prioritize and deliver business value.
- Time to value – Tracks how quickly a feature delivers business impact
Formula: Time to Value = Implementation Time + User Adoption Time
Time to value measures how quickly your team delivers features that make an impact. The faster users adopt a feature, the sooner it drives results.
Think about it - a mobile app feature takes 3 weeks to develop and 2 weeks for users to adopt, the total time to value is 5 weeks. You can review past releases to find ways to speed this up. Moreover, you can improve onboarding with clear tutorials, streamline deployment to reduce downtime, or gather user feedback early to refine functionality. Shortening time to value helps your team deliver results faster and keeps development aligned with business goals.
- Value point index – Measures the business value gained per development effort
Formula: Value Point Index = Business Value / Story Points
Value point index shows how much business impacts your team delivers for the effort invested. Tracking it helps you focus on features that drive the most value.
If a feature generates $50,000 in revenue and takes 100 story points to develop, the value point index is $500 per story point. Use this to compare past releases and prioritize high-impact features for future sprints. If one feature delivers more value with fewer resources, allocate efforts accordingly.
- Release frequency – Tracks how often new software is deployed
Formula: Release Frequency = Number of Releases / Time Period
Release frequency tracks how often your team ships updates, keeping your product evolving and aligned with market demands.
Consider this - your team deploys 12 releases over three months, that’s an average of 4 releases per month. Monitor this rate to ensure a steady flow of improvements. Increasing release frequency helps you respond to user needs faster, address issues before they escalate, and deliver continuous value. Maintain quality by automating testing, refining deployment processes, and keeping release cycles predictable.
- Release stability – Measures the success rate of releases
Formula: Release Stability = (Total Releases - Failed Releases) / Total Releases × 100
Release stability shows how often your team’s deployments succeed without issues. A steady rate keeps projects moving forward without unexpected rollbacks.
With 35 releases and only 2 failures, your stability rate is 94.3%. If that number starts slipping, look at where failures happen. Strengthen testing before deployment, refine rollback strategies, or automate checks to catch issues early. When releases go out smoothly, your team spends less time fixing problems and more time building what’s next.
") User-satisfaction metrics help improve team performance (Source: Freepik)
User-satisfaction metrics help improve team performance (Source: Freepik)- Feature Adoption Rate – Tracks how quickly and widely users adopt new features
Formula: Feature Adoption Rate = (Active Users of the Feature / Eligible Users) × 100
Feature Adoption Rate measures how effectively your team delivers features that users actively engage with. A high adoption rate means your team is building features that solve real problems and are easy to use. A low rate could indicate unclear onboarding, poor user education, or a lack of perceived value.
Imagine launching a new reporting dashboard. If 1,000 users have access but only 300 actively use it, the adoption rate is 30%. To improve this, you can enhance in-app tutorials, make feature activation more intuitive, or proactively gather user feedback for refinements.
- Retention Rate – Measures how well your product retains users over time
Formula: Retention Rate = ((Users at End of Period - New Users Acquired) / Users at Start of Period) × 100
Retention Rate reflects your product’s long-term value and user satisfaction. A high rate indicates that users find continued value in your product, while a drop could signal usability issues, poor onboarding, or unmet expectations.
For example, if you start a quarter with 10,000 users, gain 2,000 new ones, and end with 9,000, your retention rate is (9,000 - 2,000) / 10,000 × 100 = 70%. To improve this, focus on personalized onboarding, proactive customer support, and feature enhancements that align with user needs.
Process health & continuous improvement metrics
Optimizing workflows ensures efficiency and adaptability.
- Lead time – Measures the time from request to final delivery
Formula: Lead Time = Delivery Date - Request Date
Lead time tracks how long it takes for a request to turn into a delivered feature. Shorter lead times mean faster value for users and a more efficient team.
If a feature is requested on January 1 and delivered on January 15, the lead time is 14 days. When this starts creeping up, pinpoint where work slows down. Are approvals taking too long? Are development cycles stretched? Streamlining handoffs, automating approvals, or breaking work into smaller tasks can speed up delivery.
- Cycle time – Tracks how quickly a task moves from start to completion
Formula: Cycle Time = Completion Date - Start Date
Cycle time shows how efficiently tasks move from start to finish. The faster the cycle, the quicker your team delivers.
A task that starts on January 2 and wraps up on January 7 has a cycle time of 5 days. If tasks take longer, look at what’s holding them up. Are reviews creating bottlenecks? Are tasks too large to complete quickly? Breaking work into smaller pieces, streamlining approvals, and limiting distractions keeps tasks moving.
- Improvement rate – Measures how many identified issues are resolved
Formula: Improvement Rate = Implemented Improvements / Identified Issues × 100
Improvement rate measures how effectively your team turns identified issues into real solutions. A higher rate reflects a team that learns and adapts.
If your team spots 12 workflow inefficiencies and resolves 8, the improvement rate is 67%. Track this over time. If the rate climbs, your team is actively refining processes. If it stalls, check if issues are too complex or if execution needs more support. Prioritizing quick wins, encouraging team feedback, and setting clear action plans help maintain momentum.
Team well-being metrics
Happy, engaged teams work more effectively.
- Team happiness tracking – Gauges employee morale and engagement
Formula: Team Happiness Score = Average Self-Reported Satisfaction per Sprint
Team happiness tracking measures morale and engagement, giving insight into how workplace dynamics affect performance. A motivated team works more efficiently and collaborates better.
If your team reports a happiness score of 7.5/10 at the start of a sprint and 8.2/10 at the end, that's a positive shift. Monitoring this trend over multiple sprints helps you fine-tune workloads, communication styles, and support systems. If scores dip, check for burnout, unclear expectations, or process friction.
- Innovation time tracking – Ensures teams dedicate time to creative problem-solving
Formula: Innovation Time Ratio = Innovation Hours / Total Work Hours × 100
Innovation time tracking gives your team space for new ideas and long-term growth. Balancing it with core work keeps engagement high and thinking sharp.
With 8 hours per week spent on innovation projects out of 40 total hours, your team’s innovation ratio is 20%. If that number starts shrinking, check where time is going—are routine tasks taking over? Setting aside dedicated innovation hours, cutting unnecessary meetings, or automating repetitive work helps maintain the balance.
Seems like a lot of formulas, metrics, and KPIs, doesn't it? You do not need to calculate, analyze, or monitor these manually; tools like Meegle have various data analysis capabilities that do the job for you in mere minutes (or seconds!). Let's see how.
How to Track Agile Metrics Effectively
Tracking Agile metrics requires a structured approach that combines automation, team collaboration, and periodic review. Below is a breakdown of the best practices for tracking key Agile metrics:
1. Identify key focus areas
Agile teams should determine the most relevant performance indicators based on their goals. This could include measuring work progress within sprints, evaluating efficiency from task initiation to completion, monitoring workflow distribution, assessing software quality, and tracking user engagement with newly shipped features.
 Meegle - for your Agile metrics tracking
2. Use Agile management platforms
Using dedicated platforms like Meegle allows teams to track work in real time, visualize bottlenecks, and automate progress reporting. These platforms support sprint planning, backlog refinement, and release tracking to keep workflows structured and transparent.
3. Automate data collection
Manual tracking can be time-consuming and prone to errors. Automating data collection ensures accurate and real-time insights into Agile performance. This can be achieved through:
- Workflow automation tools that monitor task progression and identify blockers.
- Deployment tracking systems that provide visibility into release frequency and stability.
- Performance dashboards that consolidate key insights for quick decision-making.
4. Conduct regular retrospectives
Teams should review performance data at the end of each sprint to identify patterns, challenges, and areas for improvement. Analyzing past trends helps refine workflows, adjust priorities, and ensure Agile processes remain efficient and adaptable.
5. Align Agile tracking with business goals
Agile tracking should go beyond internal efficiency and focus on business impact. Teams should connect their tracking efforts to overall objectives, such as improving customer satisfaction, accelerating time-to-market, reducing inefficiencies, or enhancing software reliability.
") Insights from tracking Agile metrics (Source: Freepik)
Insights from tracking Agile metrics (Source: Freepik)6. Continuously optimize based on insights
Agile tracking is not a one-time process and it requires ongoing refinement. If certain performance indicators show declining trends, teams should diagnose the root causes, experiment with process improvements, and adjust workflows accordingly. A data-driven approach ensures sustained Agile efficiency and long-term success.
Tools like Meegle make it easier to track your Agile metrics. Let us see how you can use Meegle and get the most of your data to improve team performance.
Track Agile metrics and KPIs with Meegle
Meegle gives your team a clear, data-driven way to track both direct and indirect Agile metrics in one place. With the right insights, you can refine workflows, boost performance, and maintain high-quality delivery. Its features help you monitor key Agile KPIs, from efficiency and quality to team performance, without switching between tools.
Meegle fuels Agile success by:
- Delivering real-time insights into project progress and task completion rates.
- Making workflows crystal clear with visual dashboards and reporting tools.
- Encouraging continuous growth through regular sprint tracking and retrospectives.
Real-time Agile performance monitoring
Meegle’s real-time dashboards act as a command center for Agile teams. Managers and stakeholders gain instant access to velocity, cycle times, sprint completion rates, and other key performance indicators. With up-to-the-minute data, teams can adjust priorities on the fly, address potential roadblocks, and adjust strategies for maximum efficiency.
 Dashboard in Meegle
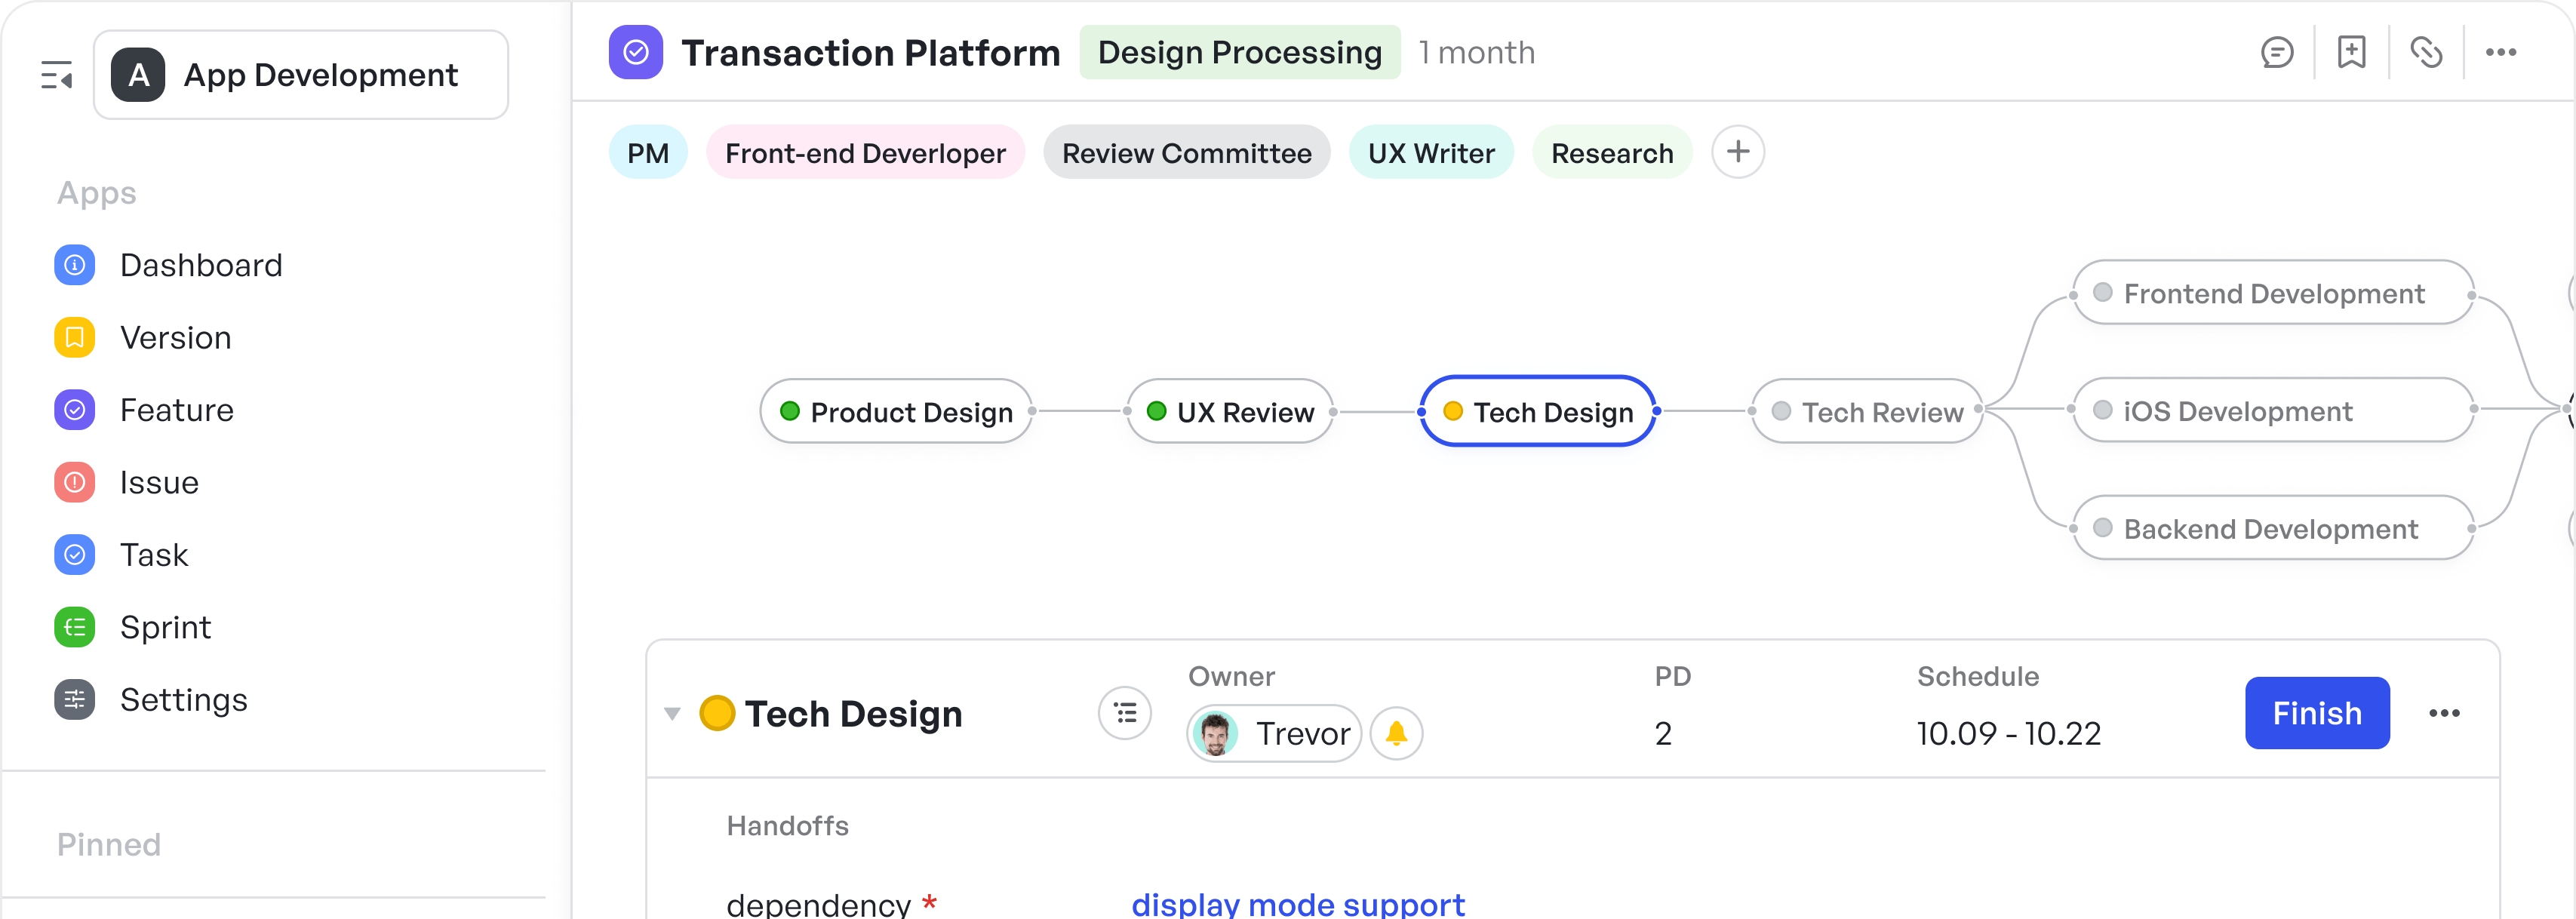
Customizable workflows: track velocity and burndown
Meegle incorporates Agile metrics directly into its workflows, giving teams a structured, data-driven way to track performance. The customizable Agile development template keeps sprint velocity, burndown rates, and lead time visible at all times. With automated tracking, teams always have clear, up-to-date insights into progress and efficiency.
 Meegle's Agile development template
If a feature request moves through a 14-day cycle, Meegle breaks down each stage, showing exactly where work slows. Handoff delays, extended reviews, or approval gaps stand out immediately, helping teams adjust workflows and keep projects on pace without waiting for retrospectives.
 Customizable Agile workflow for projects
Meegle’s Kanban boards provide real-time task management, allowing teams to shift priorities, redistribute work, and keep sprints running smoothly. When cycle time increases, teams see where tasks stall—whether in development, testing, or review—and take action to maintain steady delivery.
 Kanban View in Meegle
Workload management: keep flow steady and teams engaged
Meegle’s real-time workload tracking helps teams balance work and avoid slowdowns. If a developer has too many tasks in progress while another has availability, Meegle highlights the imbalance, allowing for an efficient workload shift. Flow efficiency measures time spent actively working, while work item age tracking identifies tasks that need attention.
 Meegle's measure module to monitor overall iteration progress
As workload shifts, Meegle helps managers distribute tasks efficiently and adjust sprint goals to maintain motivation.
Kanban and Gantt Charts: monitor throughput and WIP
Meegle’s Kanban boards and Gantt Charts provide a clear view of throughput (completed tasks over time) and WIP limits to prevent teams from taking on too much at once.
 Gantt View in Meegle
For release management, Meegle tracks release frequency and stability, ensuring smooth deployments. If trends show instability, Meegle highlights problem areas so teams can refine testing, and strengthen and automate rollback plans.
 Automated rollback in Meegle
Related Read:
Data analytics: drive improvement and innovation
Meegle’s reporting tools provide quick access to relevant Agile KPIs, helping teams make informed decisions and optimize workflows continuously. Improvement rates and innovation time tracking ensure teams stay aligned with Agile principles while focusing on measurable outcomes.
By offering real-time retrospective insights, Meegle helps teams refine processes, balance workloads, and allocate time for continuous improvement. If innovation time shrinks, Meegle flags workload imbalances, ensuring creative problem-solving remains a priority.
In fact, LIZHI used Meegle’s data analysis and automation capabilities to refine key metrics. Cycle time, lead time, and throughput improved as teams adjusted priorities with clear insights. With Meegle optimizing workflows, R&D efficiency jumped 50%, and delivery cycles moved twice as fast, keeping product releases on schedule.
FAQs
What are the metrics of Agile?
Agile metrics track team performance, efficiency, and product quality. Common metrics include velocity (work completed per sprint), cycle time (task completion speed), lead time (request to delivery), burndown rate (remaining work), and defect density (quality measurement).
What are KPIs in Agile?
Agile Key Performance Indicators (KPIs) measure progress toward goals. Common KPIs include sprint predictability (commitment vs. completion), flow efficiency (active work vs. waiting time), release frequency, team happiness, and customer satisfaction (NPS or CSAT scores).
What are Scrum metrics?
Scrum metrics focus on sprint execution and team efficiency. Key metrics include sprint velocity (work completed per sprint), burndown chart (progress tracking), sprint planning accuracy (commitment reliability), work item age (task delays), and defect resolution time.
How do you measure success in Agile?
Success in Agile is measured through on-time delivery, customer satisfaction, team engagement, and continuous improvement. Metrics like lead time, cycle time, release stability, and innovation time tracking ensure teams deliver high-quality products efficiently while adapting to change.
The world’s #1 visualized project management tool
Powered by the next gen visual workflow engineRead More
Check All BlogsStart creating impactful work today